

How to assess the impact of your interactive campaigns in your marketing strategy? This is the type of question we are used to having in Qualifio when we talk with our customers but also when we build our roadmap. Some brands measure their campaign by cost per lead (CPL), others by its docking to a more generic approach; some companies are aiming to go viral and grow their reach; others are focusing on engagement, qualification or even segmentation.
I think the magic of interactive content is its vast range of use cases. But this magic also makes interactive campaigns struggling to be pointed as a key success factor.
Are gamification and interactive marketing an art where creativity is the driving force, or can it be considered as business science where hard data is key? If so, how do we measure the impact of these campaigns in a marketing strategy? This is the question I would like to address in this post. To do so, I have gone through one of the gamification bibles, the book “Press Start” from David Griffin and Albert van der Meer. What you are going to read here, it’s maybe just a clumsy essay learned from them. But I hope it can bring you some value and light when your department is evaluating interactive marketing.
Define what the ROI of your interactive campaigns should be
There is a core idea in business: what can not be measured, can not be strategic, only a set of instruments. The key metric in business is the ROI, so “how much it costs me and how much it brings?”. It’s hard, but it is what it is. It doesn’t matter when, but this is the final question you need to answer.
The answer to the question of ROI is usually a headache for marketers because marketing is half scientific and half artistic. This is why marketers and brands typically use internal performance metrics, which generally are linked to efficiency to measure the ROI in marketing. And it is into this approach that interactive marketing actions should be well accepted.
But this does not answer our question. Imagine you are a football club and you launch a team selector, allowing your users to create their dream team. This action goes viral, gets tons of newsletter opt-ins, and creates a sense of belonging within your customers. Is this success a consequence of the idea that would have worked even with static content? Or is it because of the interactive format? We know this is a mix, but I would like to take out from the equation the “creative approach” and focus on how I would measure the impact of the interactivity on this success.
Methods to assess the impact of interactive marketing in your strategy
Measuring the impact of interactive content is always easier if it’s linked to a form. But we all know direct conversions are not always the case. In the above football example, should we measure success by the amount of opt-in collected? But… how could we know if actions like these are helping us on the renewal rates? What about the sponsorship activation or eCommerce results?
When you look at it that way, it’s not simply measuring the impact of interactivity in your marketing results. This is why, following my experience and the advice of Griffin and Van der Meer, I always recommend a straightforward tip to measure the impact of interactivity: segment your customer’s data. How? I will explain to you on the following lines:
The power of segmentation to measure your interactive marketing efforts
Segmentation and clustering should be your best friends when you try to measure the ROI of your interactive marketing actions. It means: divide your customer database into those who participate in your interactive campaigns and those who don’t, make a comparison and draw your conclusions. You can do that in two ways:
1. Before interactivity VS. after interactivity
The easiest segmentation consists of digging into the different KPIs before and after the launch of your brand’s interactive campaigns. What was the growth of your opt-in rate in the previous months, years or TTM? And the conversion rate? Is there any difference in these metrics now? These changes can be attributed to the interactive investment your brand is doing.
You can go a little bit further. Instead of digging into only “results”, you can also look at behavioural metrics to see how the engagement of your customers is evolving, before and after the implementation of an interactive campaign. The time on a webpage, the bounce rate, the new vs recurrent traffic or the number of pages per session are metrics that can give you a good hint on how to measure the ROI.
When we look at historical data, we are always affected by external factors such as market trends, competitors, special events, or even pandemic, like this year. This is why a comparative analysis of current and past trends is a good starting point, but we must remain cautious about it.
2. Bring back the control and test groups: A/B test
Before digital marketing became the new El Dorado, marketers already were used to testing and differentiate between a test and a control group. Now, we call it the A/B test. So why not also use it to measure the impact of interactive campaigns?
It should be easy: pick a random sample of your audience, call it a test or control group. Let the control group navigate on your digital channels as usual, without any interactive content, and launch your interactive action to the test group. Give them some time and later on compare the results and behaviours of both groups. This difference is what you can usually achieve by using interactive marketing on your strategy to engage, convert or segment your audience.
These are two approaches you can use to measure the impact of your interactive campaigns. But when we talk about ROI, what are the metrics you should measure? Automatically we think about revenue. However, is this the main goal of your marketing team?
Revenue and marketing are always a tricky debate. We start talking about attribution, omnichannel, brand awareness and we end up accepting the famous quote of Wanamaker: “Half the money I spend on advertising is wasted; the trouble is I don’t know which half”.
To avoid that, there are methods which go beyond the ROI. One of them, also presented by Griffin and Van der Meer is the “HEART” framework created by Google, quite popular in UX projects.
The HEART framework to assess the impact of interactive marketing
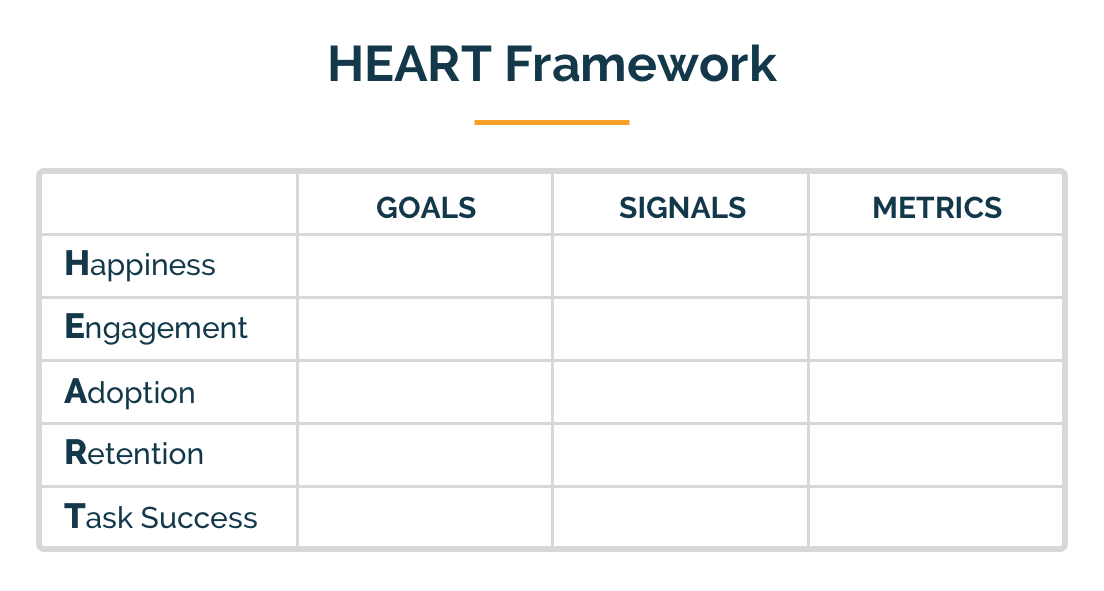
As mentioned, the HEART framework is a methodology quite popular in UX. It encompasses five aspects that can also be used on interactive marketing/gamification approaches. The five elements measured are:
- Happiness. It means how satisfied your audience/users are with your campaign. Measuring it is not so hard, you need to ask for it.
- Engagement. This is referred to as how active your audience is regarding your campaigns. It could mean, for example, how many active users and for how long they are on your page.
- Adoption. This aspect refers to the number of new users/customers you are able to attract.
- Retention. It’s the other side of the adoption. How many current customers/users are you able to keep.
- Task success. This one is internal and concerns about how to make your players’ experience easier and more efficient.
Each of these elements is divided into three additional concepts:
- Goals. It’s about what your marketing and business objective is (which is not generally the same and should not be the same but is related) and what is the objective of your audiences.
- Signals. It is a breakdown of the goals, helping you to understand success or failure in each of the 5 aspects. For example, if your goal is to increase your database, a signal can be an increase of X points in your conversion rate.
- Metrics. It is the cold data that helps you read the signals and achieve your goals.
These are the different approaches to assess the impact of interactive marketing. Because at the end of the day, the question you need to be able to answer is not only whether your campaign is right for your business, but also “is your campaign good for your business and your audience?”.